Water Quality
Information and resources on water quality issues for tribal farmers, ranchers, and resource managers.
Dissolved Oxygen
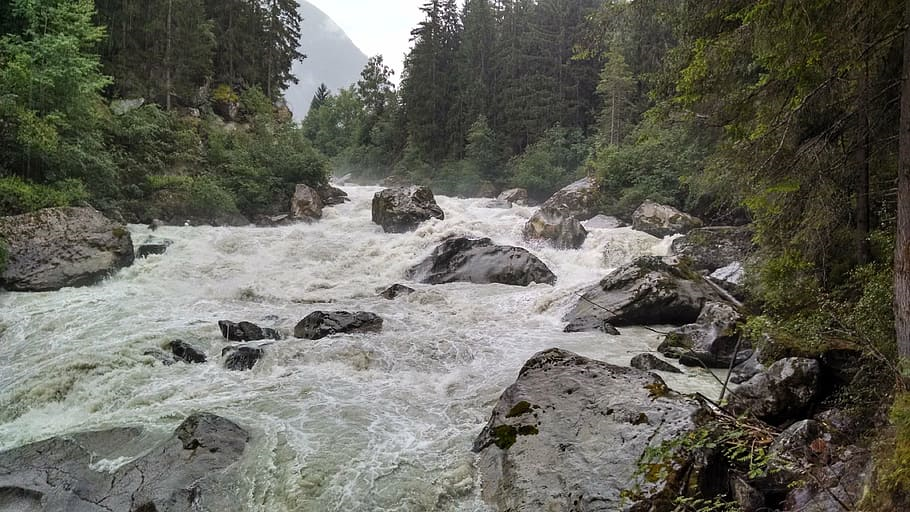
Dissolved oxygen (DO) is the amount of free oxygen available in water. This free, non-bonded, oxygen is what aquatic life needs to live. Water systems get their dissolve oxygen directly from the free oxygen in the atmosphere or through photosynthesis from plants. Higher concentrations of DO help species thrive in aquatic environments. Streams and rivers have higher concentrations of DO compared to lakes and ponds due to the churning of the swift water with the atmospheric oxygen.
The amount of DO in a stream or lake can say a lot about the quality of the water. Water in streams, rivers and in lakes have higher DO in the winter and early spring when temperatures are cooler. Lower DO is prevalent in the summertime due to the warmer temperatures. Warmer water temperatures have a lower carrying capacity for DO.
What are the effects of low dissolved oxygen in surface water?
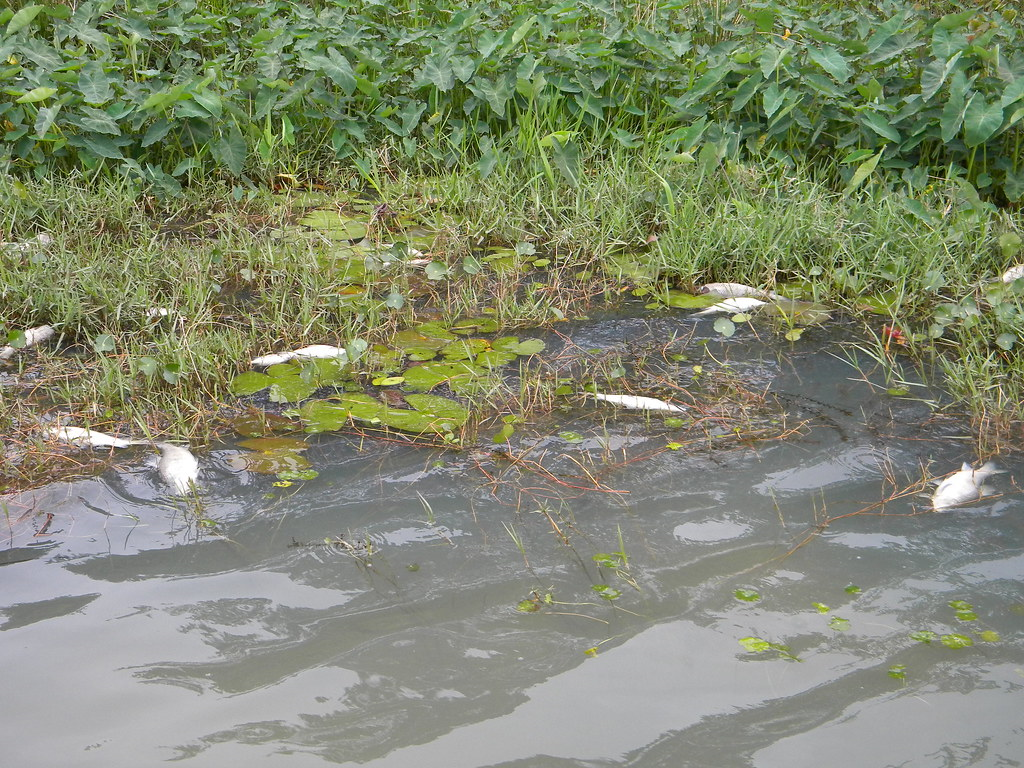
Changes in the available oxygen can be detrimental to fish and other aquatic life. Most aquatic species require at least 5 mg/L of DO. Lower levels will cause aquatic species to become stressed.
For instance, salmonids require at least 5 mg/L of dissolved oxygen to survive. However, reproduction rate declines, and birth defects may increase at this level.
*Milligrams per liter, also known as parts per million (ppm). 1 ppm is equivalent to 1 drop of water from an eyedropper in a 10-gallon barrel.
Where are low levels of dissolved oxygen most likely found?
Low levels of dissolved oxygen, also known as hypoxia, can occur when excess amounts of microorganisms decompose organic material (algae blooms) leading to the consumption of the existing DO in the water. Hypoxia can occur due to mass loading of nutrients like phosphorus and nitrogen into streams.
Low levels of DO are often found in stagnant water, slow flowing streams and rivers, and the bottoms of lakes, rivers, and streams. They are also more likely to occur in bodies of water with higher temperatures.
How do dissolved oxygen concentrations change during drought?
Dissolved oxygen shows mixed responses during drought in both rivers and streams. Some studies have shown that DO stays the same during drought, particularly in small streams that have good aeration¹. However, other studies have shown a decrease in DO in streams affected by an increase in surface temperatures. As temperature increases, biological production also increases causing the augmented bacteria to consume the existing DO in the water during decomposition of organic matter.
Warmer tempered water has a lower holding capacity for DO. As the discharge in stream decreases, less aeration results in less free oxygen being introduced into the stream or river. Point sources pollution (i.e., agriculture, mine drainage, grazing, etc.) can also flush nutrients into the stream at once if drought conditions are followed by extreme rain events.
¹Mosley, “Drought impacts on the water quality of freshwater systems”
Additional Resources
Ahmadi, B., & Moradkhani, H. (2019). Revisiting hydrological drought propagation and recovery considering water quantity and quality. Hydrological Processes, 33(10), 1492–1505. https://doi.org/10.1002/hyp.13417
Carter, K. (2008). Effects of Temperature, Dissolved Oxygen/Total Dissolved Gas, Ammonia, and pH on Salmonids- Appendix 4. North Coast Water Quality Control Board. https://www.waterboards.ca.gov/northcoast/water_issues/programs/tmdls/klamath_river/100927/staff_report/16_Appendix4_WaterQualityEffectsonSalmonids.pdf
Mesner, N., Geiger, J., (2010) Understanding Your Watershed, Dissolved Oxygen-Fact Sheet. Utah State University-Water Quality Extension. https://extension.usu.edu/waterquality/files-ou/whats-in-your-water/do/NR_WQ_2005-16dissolvedoxygen.pdf
Mosley, L. M. (2015). Drought impacts on the water quality of freshwater systems, review and integration. Earth-Science Reviews, 140, 203–214. https://doi.org/10.1016/j.earscirev.2014.11.010
United States Environmental Protection Agency (EPA), (2021). National Aquatic Research Surveys,Indicators: Dissolved Oxygen, accessed July 19, 2021 at https://www.epa.gov/national-aquaticresource-surveys/indicators-dissolved-oxygen
United States Geological Survey (USGS), (2021). Dissolved Oxygen and Water, accessed July 19, 2021 at https://www.usgs.gov/special-topic/water-science-school/science/dissolved-oxygen-and-water?qt-science_center_objects=0#
Salinity
Salinity is the total amount of dissolved salts in a body of water. The more common salt found in freshwater is sodium chloride (NaCl). Most freshwater bodies have a salinity concentration of 1,000 ppm* while the oceans have as much as 35,000 ppm of salt. Both plants and animals are very sensitive to salinity concentrations in freshwater sources. Salinity will influence the ecological composition of species in a region.
*Milligrams per liter (also known as parts per million (ppm). 1 ppm is equivalent to 1 drop of water from an eyedropper in a 10-gallon barrel.
What are the effects of high salinity concentration in surface water?
High concentrations of salinity can have a detrimental effect on drinking water sources. Saline water takes more time and energy to filter. The water balance of livestock is threatened when exposed to high concentrations of salinity in drinking water which can cause health effects and even death. Likewise, using saline water to irrigate crops can cause a decrease in the crop yield and quality. High concentrations of salinity in water can also cause degradation and erosion in soils.
In the wider environment, saline water stunts the growth of plants and can put aquatic species at risk.
Where are concentrations of high salinity in freshwater normally found?
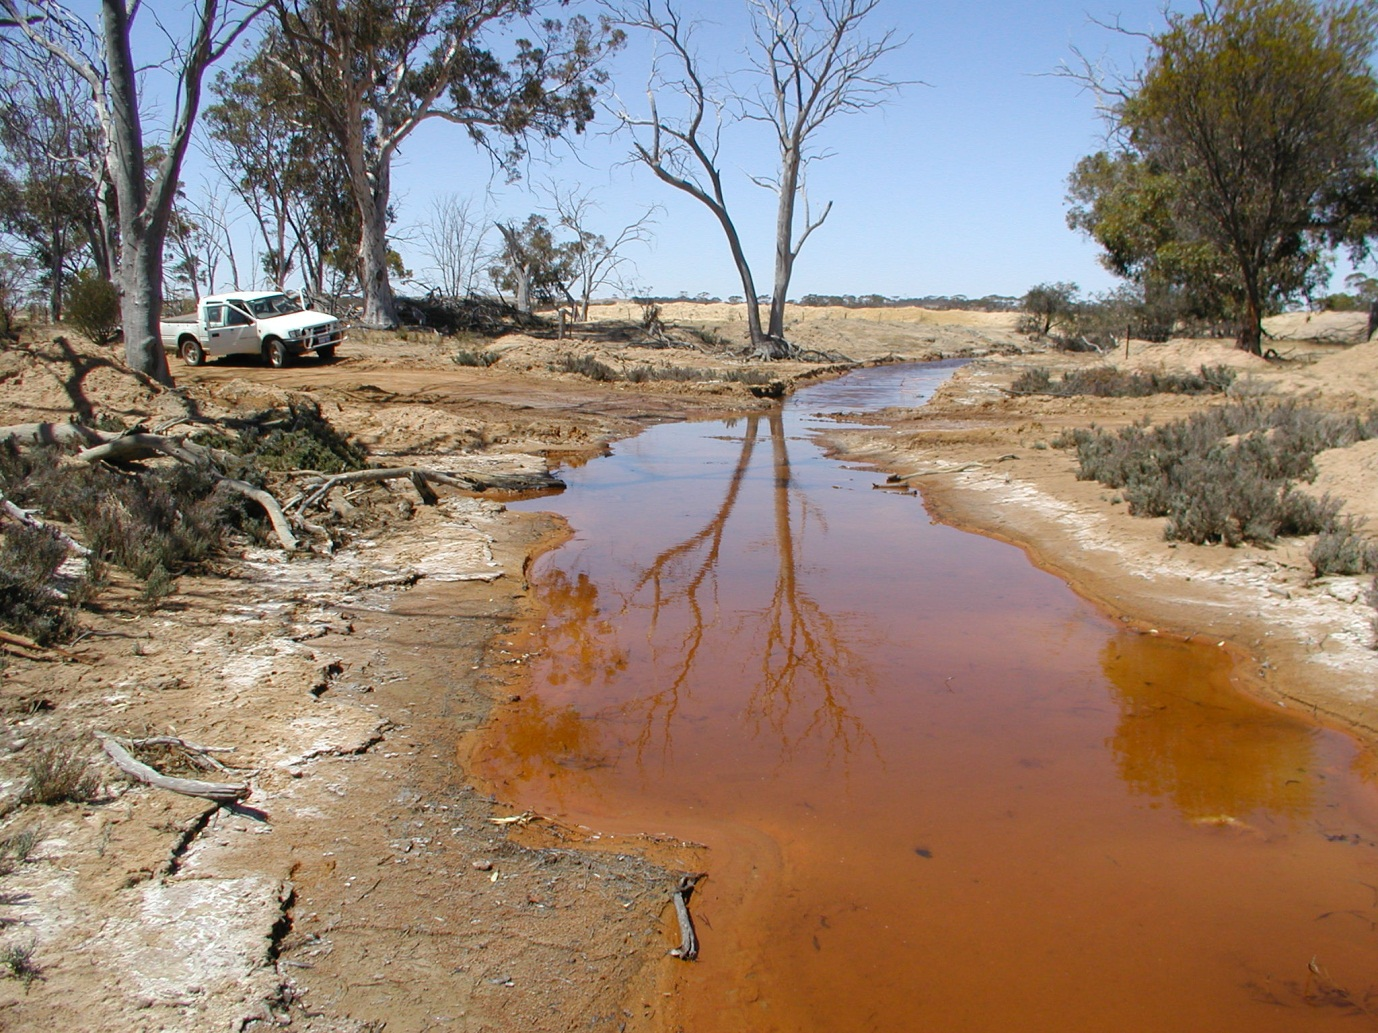
High concentrations of salinity in water are a result of the surrounding geology, irrigation water, and climatic patterns. Dry climates, where evaporation exceeds precipitation, can cause an increase in salinity since there is less mixing or dilution. For instance, the southwestern U.S. is especially vulnerable to increased salinity in freshwater due to both geology (many rocks in the Southwest have a high concentration of salt ions) and climate.
Irrigation practices can also increase salinity, since water used for irrigation sometimes contains higher levels of dissolved salts. The Colorado river becomes more saline as you move further down the river due to the irrigation practices.
Salinity in groundwater increases at depth due to the increased residence time, paleo-water trapped from previous seas, and the dissolution of minerals and rocks with high concentrations of salt ions.
How do salinity concentrations in freshwater change during drought?
During drought, salinity concentrations in surface water tend to increase. Warmer temperatures increase evaporation rates and less water is available from precipitation and snow melt. Less dilution and movement of water means that salinity increases under these conditions. With an increase in water salinity, detrimental effects can occur for both water managers, farmers, and ranchers during drought.
Salinity concentration in groundwater increases as drawdown in wells also increases. Lowering the water table can allow for intrusion from deep groundwater sources or sea water.
Additional Resources
Jones, E., & van Vliet, M. T. H. (2018). Drought impacts on river salinity in the southern US: Implications for water scarcity. Science of The Total Environment, 644, 844–853. https://doi.org/10.1016/j.scitotenv.2018.06.373
Kaushal, S. S., Likens, G. E., Pace, M. L., Utz, R. M., Haq, S., Gorman, J., & Grese, M. (2018). Freshwater salinization syndrome on a continental scale. Proceedings of the National Academy of Sciences, 115(4), E574–E583. https://doi.org/10.1073/pnas.1711234115
Mosley, L. M. (2015). Drought impacts on the water quality of freshwater systems, review and integration. Earth-Science Reviews, 140, 203–214. https://doi.org/10.1016/j.earscirev.2014.11.010

Arsenic
Arsenic is a naturally occurring element that is well distributed throughout the world. It can be found in water, air, and soil. There are two forms of arsenic present in nature:
- Inorganic arsenic is a result of arsenic’s combination with other metals and elements that do not include carbon. Inorganic arsenic is the common form of arsenic found in drinking water and some foods, like rice and cereal. It is also the most harmful type of arsenic.
- Organic arsenic is formed when arsenic combines with carbon to form a compound. Organic arsenic is mostly found in fish and shellfish. It is considered less harmful than the inorganic form.
Although mostly naturally occurring, inorganic arsenic can also be a result of human activities that include mining, smelting, and the usage of pesticides and wood preservatives.
Health Effects
Arsenic in drinking water is a global health concern. Long term ingestion of arsenic can result in lung, bladder, prostate, and skin cancer. Arsenic can also cause skin lesions, developmental effects in children, cardiovascular disease, neurotoxicity, and diabetes.
Where is arsenic most likely found?
Arsenic concentrations in drinking can occur everywhere in the United States. Arsenic concentrations in groundwater are largely determined by the surrounding geology. Currently, it is estimated that approximately 2.1-2.7 million people of the 44.1 million people in the U.S who depend on domestic wells for drinking water are exposed to elevated concentrations of arsenic above the EPA’s Drinking Water Standard of 10µg/L*¹. It is also estimated that the Southwestern U.S. is 2x more likely to exceed arsenic concentrations of 10µg/L than anywhere in the country².
*A nanogram (µg) per liter (L) also known as parts per billion (ppb) is equivalent to a single drop of food coloring in an Olympic size swimming pool.
¹ Ayotte, Medalie, Qi, Backer & Nolan. “Estimating the High-Arsenic Domestic-Well Population in the Conterminous United States.”
² Thiros, Paul, Bexfield, and Anning. “The quality of our Nation’s waters—Water quality in basin-fill aquifers of the southwestern United States.”
What are some mitigation methods to reduce arsenic in groundwater?
The removal of arsenic has proven to be difficult and costly. Some of the mitigation measures include reverse osmosis, adsorption, biogeochemical processes, coagulation, and oxidation, most of which are expensive and dependent on the groundwater composition.
Adsorption, the physical bonding of ions or molecules to a solid material, has been used as a cost effective and easier to use tool for the removal of arsenic from water ¹. Rainwater harvesting can be an alternative water resources free of arsenic. Dug well water can limit arsenic contamination but other biological contaminants may present themselves in open wells ².
¹Asere, Stevens, & Du Laing. “Use of (modified) natural adsorbents for arsenic remediation: A review.”
²Shankar, Shanker, & Shikha. “Arsenic Contamination of Groundwater: A Review of Sources, Prevalence, Health Risks, and Strategies for Mitigation.”
How do arsenic concentrations change during drought?
Temporal variability of arsenic concentrations is known to increase during the drier months due to the changes in water levels and seasonal flow paths of groundwater ¹́,². It is estimated that when precipitation decreases by 25% and groundwater recharge decreases by 50% during drought, the population with dangerously high concentration of arsenic in domestic wells increases by about 54%².
Studies have shown that arsenic concentrations increase after wildfires, particularly in areas where mining was evident, and vegetation has been lost increasing erosion and causing increased movement of heavy metals into surface water³. Scientists encourage people to regularly test domestic wells for arsenic ².
¹Ayotte, Belaval, Olson, Burow, Flanagan, Hinkle, & Lindsey. “Factors affecting temporal variability of arsenic in groundwater used for drinking water supply in the United States.”
²Lombard, Daniel, Jeddy, Hay, & Ayotte. “Assessing the Impact of Drought on Arsenic Exposure from Private Domestic Wells in the Conterminous United States.”
³Murphy, McCleskey, Martin, Holloway, & Writer. “Wildfire-driven changes in hydrology mobilize arsenic and metals from legacy mine waste.”
Additional Resources
Asere, T. G., Stevens, C. V., & Du Laing, G. (2019). Use of (modified) natural adsorbents for arsenic remediation: A review. Science of The Total Environment, 676, 706–720. https://doi.org/10.1016/j.scitotenv.2019.04.237
Ayotte, J. D., Belaval, M., Olson, S. A., Burow, K. R., Flanagan, S. M., Hinkle, S. R., & Lindsey, B. D. (2015). Factors affecting temporal variability of arsenic in groundwater used for drinking water supply in the United States. Science of The Total Environment, 505, 1370–1379. https://doi.org/10.1016/j.scitotenv.2014.02.057
Ayotte, J. D., Medalie, L., Qi, S. L., Backer, L. C., & Nolan, B. T. (2017). Estimating the High-Arsenic Domestic-Well Population in the Conterminous United States. Environmental Science & Technology, 51(21), 12443–12454. https://doi.org/10.1021/acs.est.7b02881
Beisner, K.R., Anning, D.W., Paul, A.P., McKinney, T.S., Huntington, J.M., Bexfield, L.M., and Thiros, S.A., 2012, Maps of estimated nitrate and arsenic concentrations in basin-fill aquifers of the southwestern United States: U.S. Geological Survey Scientific Investigations Map 3234, pamphlet 8 p., 2 sheets.
Lombard, M. A., Daniel, J., Jeddy, Z., Hay, L. E., & Ayotte, J. D. (2021). Assessing the Impact of Drought on Arsenic Exposure from Private Domestic Wells in the Conterminous United States. Environmental Science & Technology, 55(3), 1822–1831. https://doi.org/10.1021/acs.est.9b05835
Murphy, S. F., McCleskey, R. B., Martin, D. A., Holloway, J. M., & Writer, J. H. (2020). Wildfire-driven changes in hydrology mobilize arsenic and metals from legacy mine waste. Science of The Total Environment, 743, 140635. https://doi.org/10.1016/j.scitotenv.2020.140635
Shankar, S., Shanker, U., & Shikha. (2014). Arsenic Contamination of Groundwater: A Review of Sources, Prevalence, Health Risks, and Strategies for Mitigation. The Scientific World Journal, 2014, 1–18. https://doi.org/10.1155/2014/304524
Spaur, M., Lombard, M. A., Ayotte, J. D., Harvey, D. E., Bostick, B. C., Chillrud, S. N., Navas-Acien, A., & Nigra, A. E. (2021). Associations between private well water and community water supply arsenic concentrations in the conterminous United States. Science of The Total Environment, 787, 147555. https://doi.org/10.1016/j.scitotenv.2021.147555
Thiros, S.A., Paul, A.P., Bexfield, L.M., and Anning, D.W., 2014, The quality of our Nation’s waters—Water quality in basin-fill aquifers of the southwestern United States: Arizona, California, Colorado, Nevada, New Mexico, and Utah, 1993–2009: U.S. Geological Survey Circular 1358, 113 p., http://dx.doi.org/10.3133/cir1358.
World Health Organization—WHO (2011). Arsenic in Drinking Water. Background Document for Development of WHO Guidelines for Drinking-Water Quality. Retrieved from: https://www.who.int/water_sanitation_health/dwq/chemicals/arsenic.pdf?ua=1
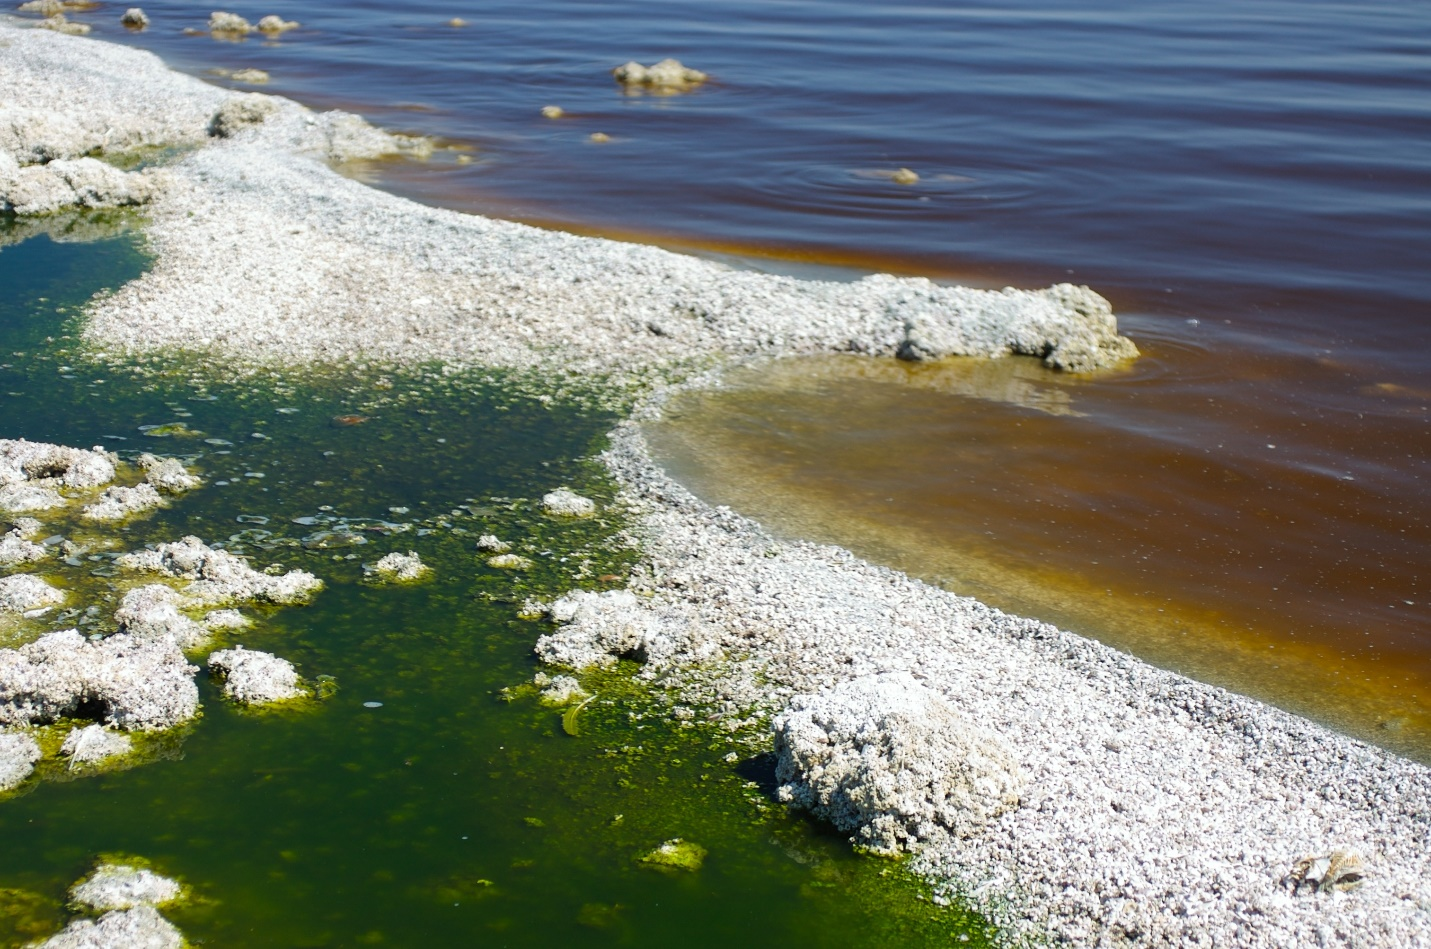
Algal Blooms
Algae and cyanobacteria are plant-like organisms that exist in most bodies of water. They can vary from single cell organisms to more complex multi-cellular organisms. While they are naturally occurring and usually harmless, they can become harmful algal blooms when amplified by certain conditions.
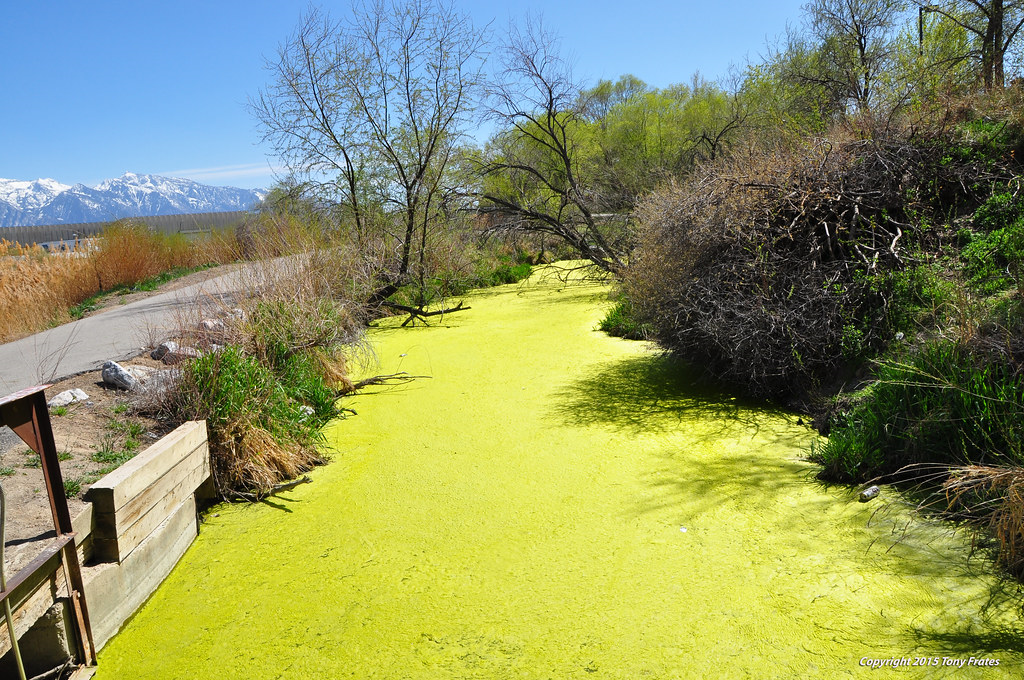
An algal bloom occurs when there is a rapid increase in productivity by these organisms. The blooms are visible on the surface of the water and can vary in color, shape, and form. Algal blooms form on the surface of fresh, salt, and brackish water. They are caused by an increase in water temperatures, abundance of sunlight, slow-moving water, and excessive amounts of nutrients (phosphorus and nitrogen).
Health Effects
Algae and cyanobacteria can be extremely harmful to humans, pets, and livestock. Algal blooms will cause a degradation of the water quality affecting the aquatic life as well. Direct exposure to the toxic algae can cause serious health problems which include rashes, stomach and liver problems, respiratory problems, and neurological effects for humans. Exposure to toxic algal blooms can also lead to death. Animals are also vulnerable to the toxins which can cause extreme sickness or death.
Where are algae blooms found?
Algal blooms can occur in almost any body of water; however, there is an increased risk of algal blooms in slow-moving water like depleted rivers and still water like lakes and reservoirs. Bodies of water with excessive nutrient pollution (too much nitrogen and phosphorus) are more likely to develop harmful algal blooms. Algal blooms depend on warmer water, making summer and early fall the primetime for blooms. Point sources like industrial and wastewater treatments plant discharges can contribute to an increase in productivity by algae and cyanobacteria. Non-point sources such as leaking septic tanks and stormwater runoff can contribute to an increase of algae and cyanobacteria as well.
How do algal blooms change during drought?
Algal blooms intensify during drought conditions as temperatures increase and less water is available. Algae and cyanobacteria thrive in excessive sunlight and warm tempered, nutrient rich, slow moving water. Increased algal blooms are also seen after extreme storms following drought since all the nutrients are flushed out at once. The increase in algal blooms decreases the quality of water resources for drinking, recreation, food supply, environment, and the economy.
Algal blooms have become common in the west, increasing water scarcity by lowering the quality of the already scarce water resources.
Additional Resources
Bradford, N., (2021) Algal Blooms are Blooming, National Environmental Education Foundation (NEEF). Retrieved from: https://www.neefusa.org/nature/water/algal-blooms-are-blooming
Center for Disease Control and Prevention (2021) Harmful Algal Bloom (HAB)-Associated Illness. Retrieved from: https://www.cdc.gov/habs/be-aware-habs.html
Mosley, L. M. (2015). Drought impacts on the water quality of freshwater systems; review and integration. Earth-Science Reviews, 140, 203–214. https://doi.org/10.1016/j.earscirev.2014.11.010
Saint Johns River Water Management District (2021) Understanding Algal Blooms. Retrieved from: https://www.sjrwmd.com/education/algae/#why-do-algal-blooms-occur
Southern California Coastal Water Research Project (2021) Research Areas, Eutrophication. Retrieved from: https://www.sccwrp.org/about/research-areas/eutrophication/
United States Environmental Protection Agency (2021) Nutrient Pollution, Climate Change and Harmful Algal Blooms. Retrieved from: https://www.epa.gov/nutrientpollution/climate-change-and-harmful-algal-blooms

Nitrogen
Nitrogen (N) is a naturally occurring and well distributed element on Earth. Nitrogen is the most abundant gas in the air that we breathe. Nitrogen, like phosphorus is an essential nutrient for plant growth. Nitrogen has various forms including nitrate, nitrite, and ammonium (total nitrogen*). Nitrate (NO₃), Nitrite (NO₂⁻) and ammonium (NH₄⁺) are the mobilized form of nitrogen that are commonly found in surface and ground water. While nitrates, nitrites, and ammonium occur naturally, concentrations can be increased by human activities. According to the EPA Drinking Water Standards, nitrogen concentrations for nitrate should not surpass 10 mg/L** and 1 mg/L for nitrites.
*Total nitrogen is the sum of concentrations of nitrate, nitrite, and ammonium.
** Milligrams per liter also known as parts per million (ppm) is equivalent to 4 drops of food coloring in a 55-gallon barrel.
Health Effects
Excessive amounts of total nitrogen can lead to lower levels of dissolved oxygen and eutrophication (excessive nutrients in a body of water). Low dissolved oxygen can cause fish die-offs, excessive algae and plant growth, and poor water quality.
When ingested, high concentrations of nitrate (the mobilized version of nitrogen) can affect how the blood carries oxygen. Too much nitrate can result in infant methemoglobinemia (blue baby syndrome), birth defects, thyroid disease, and cancer. Excessive amounts of nitrate can also affect young livestock.
Where are high concentrations of nitrogen in freshwater usually found?
Higher concentrations of nitrogen are introduced to the environment from sewage and fertilizers. Chemical fertilizers and animal manure have high concentrations of nutrients which can be released into a waterbody through runoff and leaching. Shallow aquifers are at great risk for excessive concentrations of total nitrogen, particularly nitrate, due to nitrate seeping into the groundwater from agricultural practices or sewage pipes. Excessive concentration of total nitrogen is common near point source pollution from agricultural farms, ranches, areas with cattle grazing, and wastewater treatment plants.
How do nitrogen concentrations in freshwater change during drought?
Nitrogen concentrations show a mixed response during drought. Some studies show an increase in total nitrogen in water since less water means that the nitrogen is less diluted. If agricultural practices such as fertilizing and irrigation continue while less water is available, concentrations will increase. In contrast, other studies have shown that total nitrogen decreases during drought. This might be a response due to less water available for mobilization of the nutrients and lower agricultural activity. High concentrations of nutrients can enter freshwater sources if long periods of drought are followed by intense rainfall. A recent study by Levy et al., (2021) shows concentrations of nitrogen increasing during drought as excessive drawdown in groundwater sources increased. As water is pulled downward, shallow groundwater rich in nitrogen also moved downward contaminating deeper water used for drinking¹.
Resources
¹Levy, Z. F., Jurgens, B. C., Burow, K. R., Voss, S. A., Faulkner, K. E., Arroyo‐Lopez, J. A., & Fram, M. S. (2021). Critical Aquifer Overdraft Accelerates Degradation of Groundwater Quality in California’s Central Valley During Drought. Geophysical Research Letters, 48(17). https://doi.org/10.1029/2021GL094398
Mosley, L. M. (2015). Drought impacts on the water quality of freshwater systems, review, and integration. Earth-Science Reviews, 140, 203–214. https://doi.org/10.1016/j.earscirev.2014.11.010
United States Geological Survey (2021) Nitrogen in Water, Water Science School. Retrieved from: https://www.usgs.gov/special-topic/water-science-school/science/nitrogen-and-water?qt-science_center_objects=0#qt-science_center_objects
Wall, D., (2013) Nitrogen in Waters: Forms and Concern. Minnesota Pollution Control Agency. Retrieved from: https://www.pca.state.mn.us/sites/default/files/wq-s6-26a2.pdf
Phosphorus
Phosphorus is a naturally occurring element and mineral that is found in rocks, soils, and organic material. Phosphorus, like nitrogen, provides nourishment for plant and animal growth. Although phosphorus is an essential nutrient, too much phosphorus in freshwater can have negatively affect water quality. Phosphorus levels are naturally regulated by intake by plants.
However, phosphorus is also a common ingredient in many fertilizers, manure, and other chemicals which are commonly used in agriculture. High concentrations of phosphorus can occur in areas with lots of human activity. This leads to an expansive growth in aquatic plants and algae that consume an abundance of dissolved oxygen (DO). Low levels of DO can cause fish die-offs and harm other aquatic life.
Health Effects
An increased concentration in phosphorous can cause a bloom of toxic algae and cyanobacteria that can pose a danger to human and animal health. Harmful algal blooms can cause rashes, stomach and liver diseases, respiratory problems, and neurological effects through ingestion or physical contact of contaminated water. Dissolved oxygen shortages in water as a result of high phosphorus levels and subsequent algal blooms can have harmful effect on aquatic species.
Where are high concentrations of phophorus in freshwater found?
Point source pollution is one of the main factors in increase nutrients in freshwater. Point source pollution is defined by the Environmental Protection Agency (EPA) as any contaminant that enters the environment from a specific, easily identifiable, concentrated place. Some examples of point source pollution for freshwater bodies include mines, discharge pipes, drainage ditches, conduits, and channels. A smokestack or chimney are an example of point source pollution affecting air quality. Areas with heavy agricultural activity are more susceptible to high concentrations of phosphorus in surface water.
How do phosphorus concentrations in freshwater change during drought?
Phosphorus concentrations during drought have mixed responses. Studies have shown a decrease in phosphorus during drought in many streams, rivers, and lakes. This is attributed to the lack or minimal inputs into a catchment since there is a reduction in precipitation and agricultural runoff. In contrast, phosphorus concentrations have also increased in areas where point source pollution goes uninterrupted (domestic, industrial, agricultural wastewater discharge) and less water is available for dilution¹. High concentrations of nutrients can enter freshwater sources if long periods of drought are followed by intense rainfall.
Resources
Lisboa, M. S., Schneider, R. L., Sullivan, P. J., & Walter, M. T. (2020). Drought and post-drought rain effect on stream phosphorus and other nutrient losses in the Northeastern USA. Journal of Hydrology: Regional Studies, 28, 100672. https://doi.org/10.1016/j.ejrh.2020.100672
Litke, D.W., (1999) Review of Phosphorus Control Measures in the United States and Their Effects on Water Quality. United States Geological Survey, Water Resources Investigation Report 99-4007 https://doi.org/10.3133/wri994007
¹Mosley, L. M. (2015). Drought impacts on the water quality of freshwater systems; review and integration. Earth-Science Reviews, 140, 203–214. https://doi.org/10.1016/j.earscirev.2014.11.010
United States Environmental Protection Agency (2021) National Aquatic Research Surveys. Indicators: Phosphorus. Retrieved from: https://www.epa.gov/national-aquatic-resource-surveys/indicators-phosphorus
United States Geological Survey (2021) Water Science School, Phosphorus and Water. Retrieved from: https://www.usgs.gov/special-topic/water-science-school/science/phosphorus-and-water?qt-science_center_objects=0#qt-science_center_objects